Sign the petition
Help us show our elected officials, local and state government and agencies that we want independent air quality data.
To the Mountain Recreation and Conservation Authority (MRCA), Conejo Recreation and Park District, Santa Monica Mountains Conservancy, Rancho Simi Recreation and Park District, City of Simi Valley, Bell Canyon Community Services District, Bell Canyon Association, Ventura County Supervisor Janice Parvin, Los Angeles County Supervisor Lindsey Horvath, California State Senator Henry Stern, California Assemblymember Jacqui Irwin, and the State of California:
The undersigned residents respectfully request your support for an independent air monitoring initiative led by Parents Against Santa Susana Field Lab (PASSFL) in collaboration with Dr. Nicholas Spada of the UC Davis Air Quality Research Center. The purpose of this project is to provide independent, transparent, and publicly accessible data regarding potential airborne releases associated with cleanup activities at the Santa Susana Field Laboratory (SSFL), which are expected to begin in 2026.
To establish a scientifically robust monitoring network, the project requires authorization and access for the installation and maintenance of research-grade air quality monitoring equipment at strategic locations potentially including but not limited to, Sage Ranch Park, Runkle Canyon Open Space, Upper Las Virgenes Canyon Open Space Preserve, and open space areas within Bell Canyon. The monitoring equipment has been acquired through community fundraising efforts, grants, and contributions from PASSFL and its partners.
This independent monitoring program will help ensure that nearby communities, public agencies, researchers, and decision-makers have access to reliable, real-time environmental data throughout the duration of SSFL cleanup activities.
We respectfully request your cooperation and assistance in facilitating the necessary approvals and access agreements so that monitoring can be established as soon as possible, prior to the commencement of major cleanup activities.
Thank you for your consideration and for your commitment to protecting public health, environmental quality, and community transparency.
Air Monitoring Details
Project Summary
The Air Monitoring project will begin with a limited scope as quickly as possible to begin monitoring as soon as Boeing begins cleanup activities at the site. Due to the urgency, we have built in flexibility with the implementation and will add components as funds allow.
Winter/Spring 2026: Fundraising, finding volunteer hosts for monitors
Summer/Fall 2026: Installation of a minimum of three QuantAQ monitors, three radiological monitors, analysis of data, community workshops
2027: DRUM Sampling by UC, Davis to “speciate” air samples, purchase and implement additional monitors for improved data, continue community outreach and education
Equipment
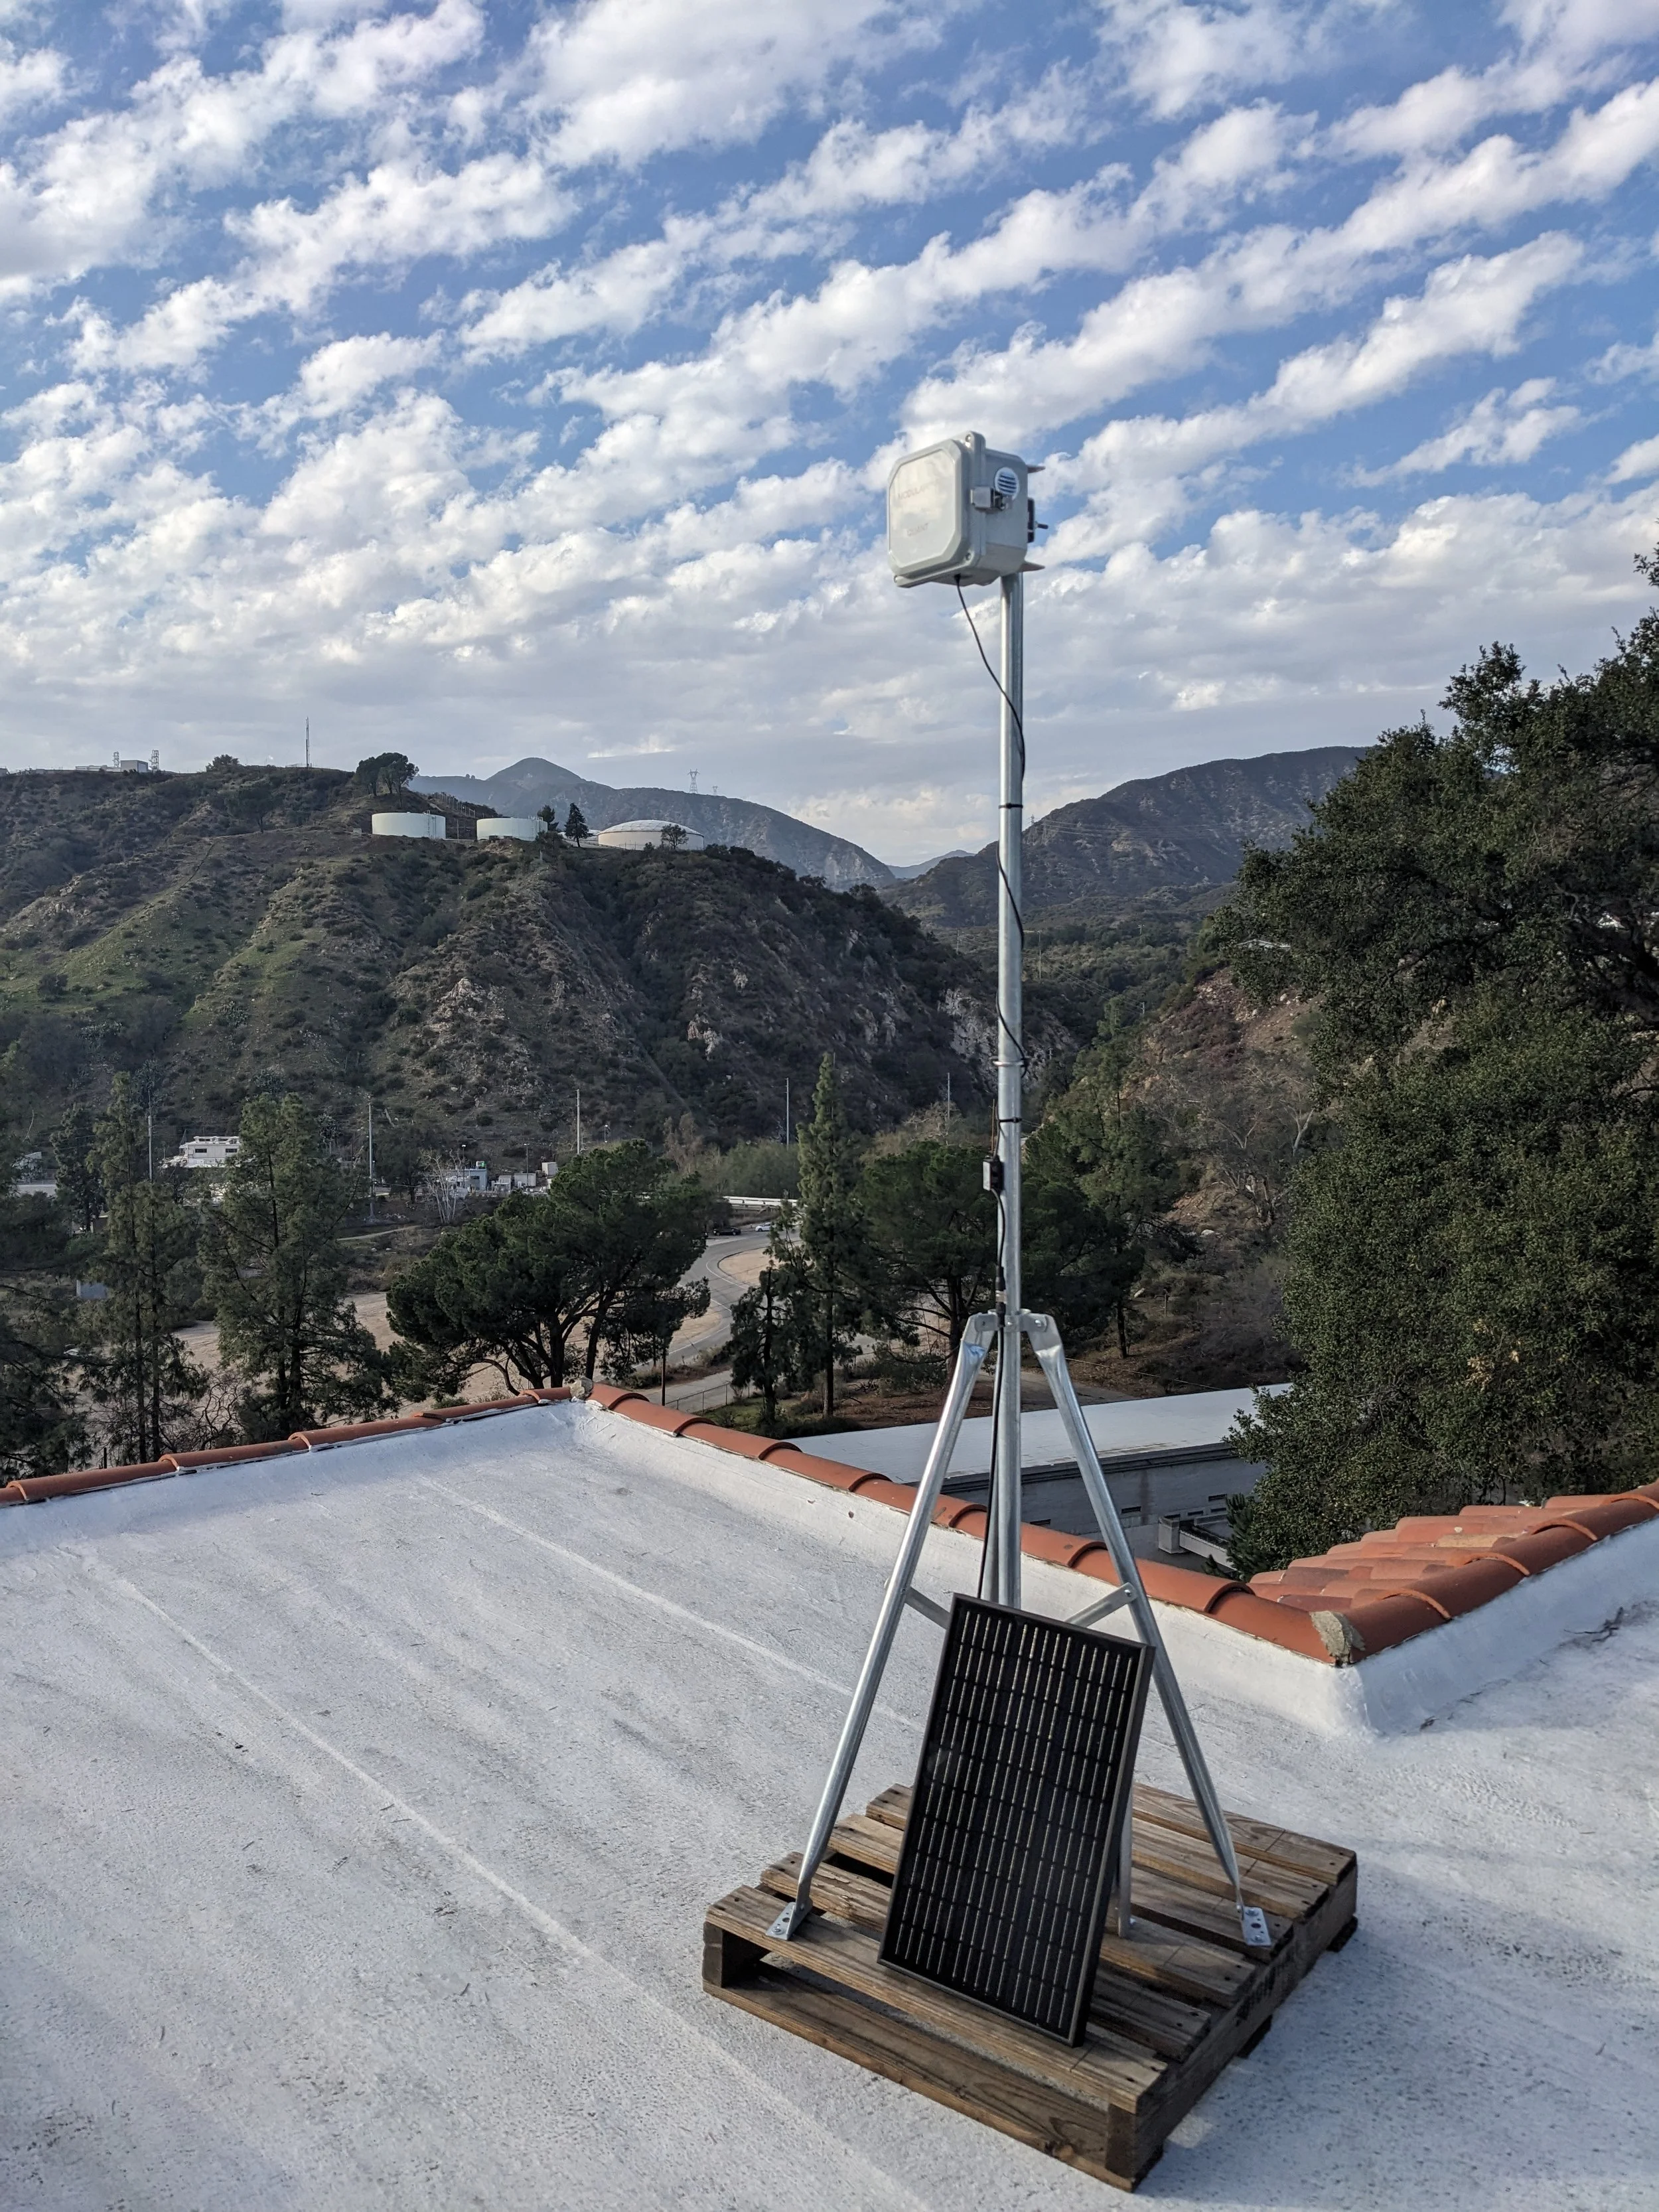
QuantAQ Research-Grade Air Monitors (four total)
PASSFL has purchased three QuantAQ research-grade air monitors
One additional QuantAQ research-grade air monitor, measuring:
PM2.5 (fine particulate matter ≤ 2.5 microns)
PM10 (coarse particulate matter ≤ 10 microns)
Volatile Organic Compounds (VOCs)
Local meteorological conditions
Data uploaded to the web for public access
Radiological Air Monitors (three total)
Continuous Low-Flow Radiological Monitors (2 units)
Commercial-grade radiological air monitors
Equipped with beta and gamma radiation detectorsReal-time online data access
Sample approximately 3 liters of air per day (each unit)
Designed to record and report long-term average radiation levels over multi-week period
Data automatically uploaded to a public-facing website for transparency
High-Volume Radiological “Sample Train” Monitor (1 unit)
Deployed when low-flow monitors indicate a potential radiological plume or elevated readings
Capable of detecting plume events within minutes
Collects approximately 57,600 liters of air per day during 1–2 day deployment periods
Provides high-resolution short-term event sampling
Data uploaded to a public-facing website for transparency
DRUM Sampling, UC Davis
The DRUM is not commercially available, and all measurements of the samples are custom instrumentation, designed and built at Crocker Nuclear Laboratory of UC Davis.
DRUM samples undergo a series of non-destructive analyses, including:
Soft-Beta Ray Attenuation (Mass)
Broadband Transmittance/Reflectance Spectrometry (optical properties): The transmittance measurements can be converted to "black carbon" using peer-reviewed mass scattering coefficients
Ion Beam Analysis (elements): Proton Elastic Scattering Analysis (PESA), Proton Induced X-ray Emission (PIXE), and Rutherford BackScattering (RBS) provide concentrations of hydrogen (surrogate OC), carbon (surrogate EC), and sodium through arsenic plus lead.
Monitors PM2.5-PM10 and Mass, hydrogen, carbon (equivalent to EC), sodium, magnesium, aluminum, silicon, phosphorus, sulfur, chlorine, potassium, calcium, titanium, vanadium, chromium, manganese, iron, cobalt, nickel, copper, zinc, arsenic, and lead.
Data analysis will take weeks to months to process and will be made public when available.
Independent Analysis and Support
Academic advice and technical support from UC Davis Air Quality Research Center
Independent air quality data analysis and technical support from TD Environmental Services
Community air-quality training, enabling residents to understand and use the data from TD Environmental Services
Radiological air quality data analysis and technical review provided by Boston Chemical Data Corporation
Project Management
PASSFL will oversee all aspects of project implementation to ensure the project remains responsive, scientifically credible, and aligned with public health protection goals, including but not limited to:
Field operations and monitor deployment
Interagency and stakeholder coordination
Data transparency and accountability measures
Ongoing community outreach and engagement

Host
Become a Citizen Scientist
For the first phase of the Air Monitoring Network, we will prioritize areas highlighted in yellow on the map. If you live in one of the priority areas we’d be grateful if you’d host a monitor on your property. Monitors will need access to your electricity and WiFi to work. Data collected at your home would be public, but your address and name would remain anonymous.
Air monitors will be provided to hosts within the priority areas at no cost.
LEARN

Our DATA
coming soon
Click on the map to learn about the air quality in your area and if the Santa Susana Field Lab is putting your community’s health at risk through toxic air pollution.